As raster imagery#
A lot of packages rasterize HEALPix maps using a destination pull interpolation (most common: nearest neighbour).
Existing software:
healpy: static image, single variable, a few projections (gnomonic, cartesian, mollweide), spherical onlyeasy.gems: static image, single variable, projections viacartopy, spherical only
import xdggs

ds = xdggs.tutorial.open_dataset("air_temperature", "healpix").compute().dggs.decode()
ds
<xarray.Dataset> Size: 10MB
Dimensions:   (time: 2920, cells: 434)
Coordinates:
  * time      (time) datetime64[ns] 23kB 2013-01-01 ... 2014-12-31T18:00:00
    lon       (cells) float64 3kB 227.8 222.2 225.0 239.1 ... 272.8 267.2 270.0
    lat       (cells) float64 3kB 14.48 14.48 16.96 14.48 ... 35.69 35.69 38.68
  * cell_ids  (cells) int64 3kB 525 526 527 529 530 ... 2043 2044 2045 2046 2047
Dimensions without coordinates: cells
Data variables:
    air       (time, cells) float64 10MB nan nan 294.1 nan ... 272.6 270.8 265.0
Indexes:
    cell_ids  HealpixIndex(level=4, indexing_scheme=nested)
Attributes:
    Conventions:  COARDS
    title:        4x daily NMC reanalysis (1948)
    description:  Data is from NMC initialized reanalysis\n(4x/day).  These a...
    platform:     Model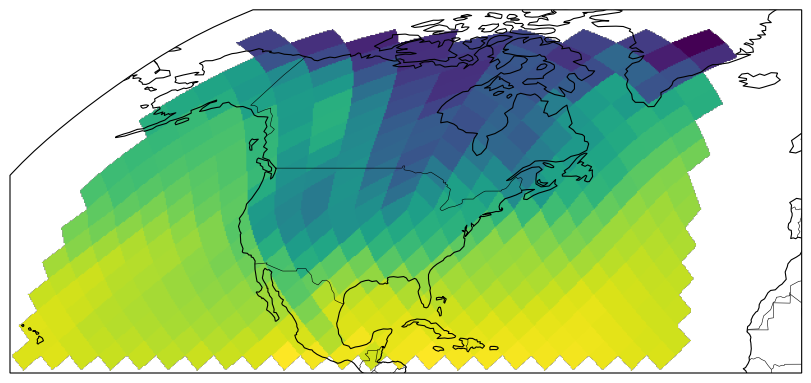
references: http://www.esrl.noaa.gov/psd/data/gridded/data.ncep.reanaly...plotting with easy.gems#
Code | Documentation | Cookbook
The easygems package comes with the healpix_show function that will first interpolate the data onto a regular grid and then use the standard regular grid visualization functionality of matplotlib / cartopy:
import cartopy.crs as ccrs
import cartopy.feature as cf
import easygems.healpix as egh
import matplotlib.pyplot as plt
# special format needed for the cell ids coordinate / the cells dimension
var = (
    ds.assign_coords(
        crs=lambda ds: (
            (),
            0,
            {
                "grid_mapping_name": "healpix",
                "healpix_nside": 2**ds.dggs.grid_info.level,
                "healpix_nest": "nest",
            },
        )
    )
    .drop_indexes("cell_ids")
    .rename_dims({"cells": "cell"})
    .rename_vars({"cell_ids": "cell"})
    .isel(time=0)
    .set_xindex("cell")
    .get("air")
)

projection = ccrs.Robinson()
fig, ax = plt.subplots(
    figsize=(8, 4), subplot_kw={"projection": projection}, constrained_layout=True
)
ax.set_extent([200, 350, 14, 80], crs=ccrs.PlateCarree())
egh.healpix_show(var, ax=ax)
ax.add_feature(cf.COASTLINE, linewidth=0.8)
ax.add_feature(cf.BORDERS, linewidth=0.4)
<cartopy.mpl.feature_artist.FeatureArtist at 0x757c4d6b0f50>
/home/docs/checkouts/readthedocs.org/user_builds/grid4earth-tools-inventory/checkouts/latest/.pixi/envs/default/lib/python3.13/site-packages/cartopy/io/__init__.py:242: DownloadWarning: Downloading: https://naturalearth.s3.amazonaws.com/110m_physical/ne_110m_coastline.zip
  warnings.warn(f'Downloading: {url}', DownloadWarning)
/home/docs/checkouts/readthedocs.org/user_builds/grid4earth-tools-inventory/checkouts/latest/.pixi/envs/default/lib/python3.13/site-packages/cartopy/io/__init__.py:242: DownloadWarning: Downloading: https://naturalearth.s3.amazonaws.com/110m_cultural/ne_110m_admin_0_boundary_lines_land.zip
  warnings.warn(f'Downloading: {url}', DownloadWarning)